Utilising weather tools for enhanced turf maintenance
Working with turf is a fine art. You have to balance your knowledge of the site, water management, staff, latest innovations in technology and budgeting. You have to know when the best time is to undertake work.
To help with forward planning, utilising best practice techniques, and to aid in making and justifying your decisions, Syngenta have developed a number of tools to assist you. They provide information to assist with key decision making and provide additional data for more informed decisions. Plus, with all these tools being hosted within the integrated hub of Syngenta’s Greencast Services, it’s simple to find all the information you need in one place.
In last month’s edition of Growth Season Magazine, we looked at predicting spray windows as well as calibration tools. This month we’ll look at the historical weather data and the in-depth weather forecasting tools that are available from Syngenta’s Greencast Services.
Historical Weather Data
Syngenta’s Historical Weather tool is an invaluable data source for visualising past weather patterns impacting the turf in your specific location. It is a multi-graphical condition output graph with a flexible timeline. The variety of graph options available includes temperature, rainfall, soil temperature, long-term extremes or averages, and seasonal comparisons. The output can be scaled by daily, weekly or monthly averages. And the graphs can be easily exported for use in presentations and reports.
Historical data on your location can assist you in forward planning and preventative programs. It can also assist with report development and in reviewing the results of past programs to then plan ahead more confidently what to do when and why, and in doing so can lead to a reduction in chemical applications required each year.
Herbicide applications
For example, looking at the graph below (figure 1) you can see that coming out of winter in 2020, temperatures in Windsor NSW began to stay consistently above 18°C from 26 August. Around 18-19°C is when summer weeds will likely start to germinate. If the season in 2021 is tracking similarly, the appropriate time to treat with a pre-emergent is 2 weeks beforehand, in early-to-mid August.
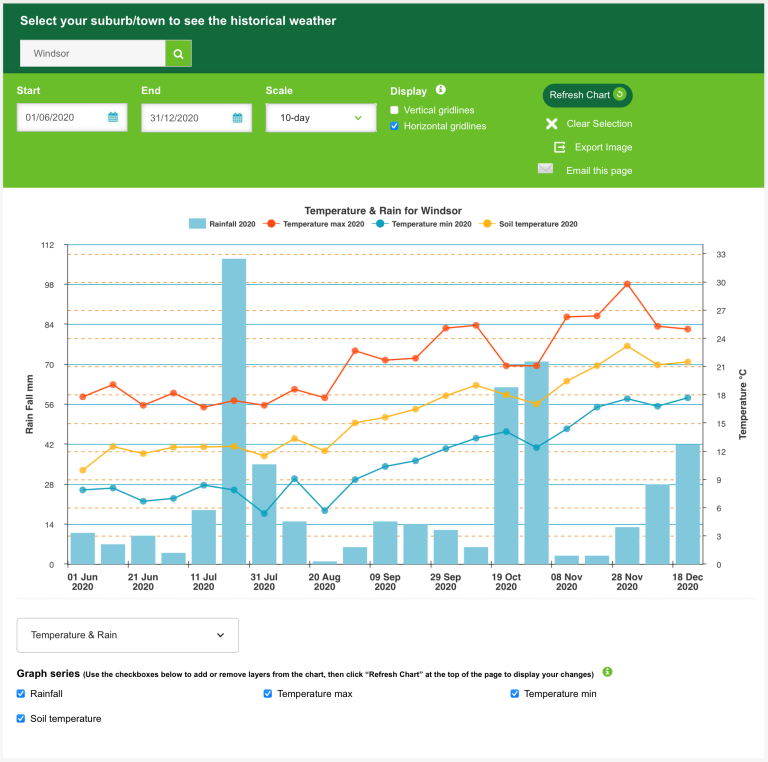
Figure 1: For efficient control, apply a pre-emergent for summer weeds approximately two weeks before temperatures are consistently above 18°C.
Based on 2019 - 2020 temperatures in Windsor NSW soil temperatures begin to reliably reach 15°C in August as can be seen in the previous year graph and the prior year graph (Figure 2). At 15°C common turf grass weeds will start to or be close to germinating. Based on critical weather information, an application of PENNMAG® Herbicide can be planned to preventatively stop weeds before they germinate. Summer Grass begins to germinate between 12-15°C, Crowsfoot Grass 16-18°C and Poa Annua below 21°C. However, with Poa it is also not uncommon to see ecotypes that germinate over a wider range of soil temperatures. The historical weather lets you base best timing on current and historical knowledge to plan your program in a more robust manner.
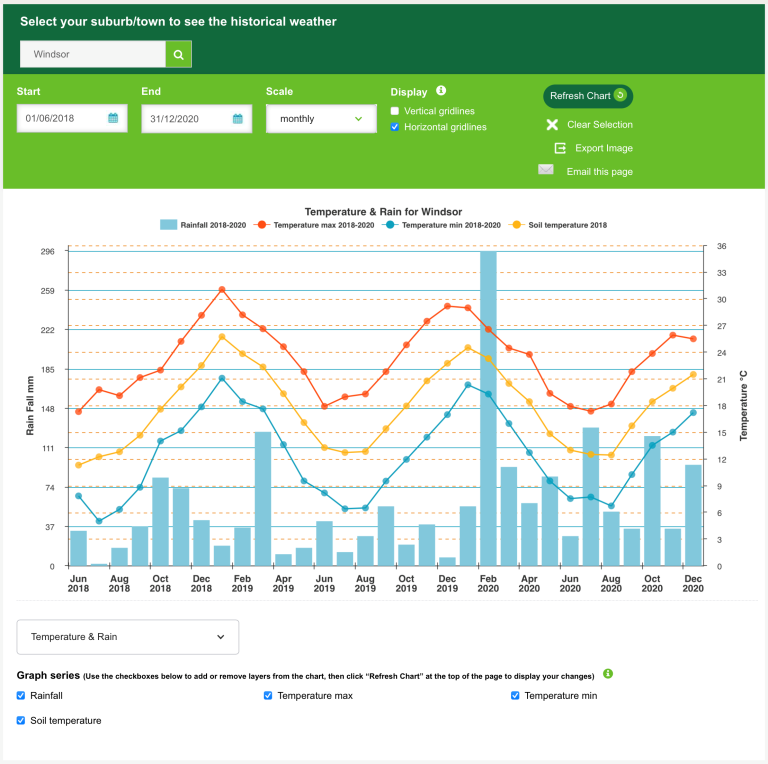
Figure 2: Previous and prior year graph to plan best timing for herbicide program.
Insecticide applications
Let’s look at Mites - historical weather data can also help direct the first insecticide application to ensure population management before damage occurs. Mites start to become more active around 20°C average air temperatures so an application at this time will ensure population knockdown before optimum development occurs at 24°C. This regularly aligns with an early spring application in September. An application of AGADOR® Insecticide will deliver a knockdown of the pest for 2 weeks when they start to become active after overwintering. Following this with an application of HIGRAN® will continue to control the population for another 4 weeks. For mites it is critical to manage the population early before they have a chance to establish and critically damage turf.
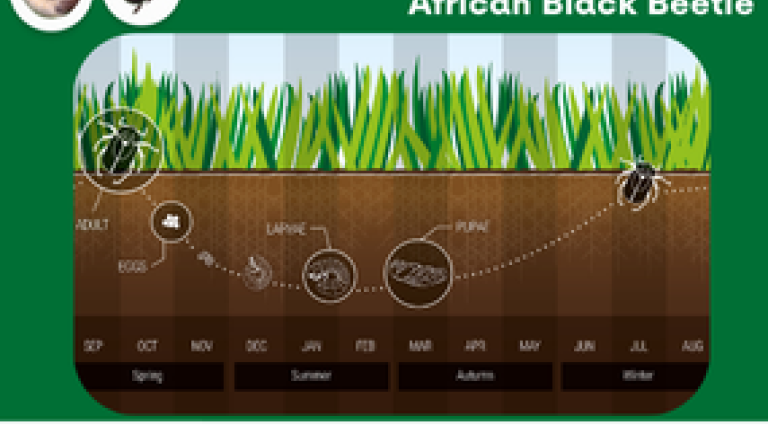
Similarly, when targeting African Black beetle, the adults become active and first flights are observed when average air temperatures are between 15-17°C. Depending on the year, an application between the start of August and the start of September with ACELEPRYN® Insecticide will cover the egg laying period and development of instars and ensure effective preventative control. A let application may result in sub optimal control. Due to the longevity and effectiveness of ACELEPRYN® an early application will also control any secondary infestations and other scarabs like Argentine Scarab. ACELEPRYN® delivers the season-long control of up to 6 months.
Historic Weather Data is available to all registered users of to the Syngenta Turf & Landscape website.
- Assists with preventative programs.
- Maximise efficacy and longevity of product applications, based on seasonal changes and application timing.
- Various selections – data includes temperature, rainfall, soil temperature, long-term extremes or averages, seasonal comparisons.
- Each selection has a 2 Y axis graph (left and right) with multi selection options and can be scaled for daily, weekly, or monthly averages over multiple seasons and years
- Aid in reducing the number of chemical applications per year
- Report development and review of past program results
- Extract data graphs for your specific location and export for use in presentations
Greencast Pro Weather
Recently added to the Greencast Services is Greencast Pro Weather which provides overview mapping of current and forecasted weather patterns.
This tool provides insight into the key weather features that impact directly on how you manage your turf. With easy to interpret, visual representation of weather forecasts for your location you will have all the information you need to aid in turf management decisions.
This easy-to-use tool allows you to simply search your location and gain full information and insight to help plan your turf management strategies. The images (figures 3 and 4) represent current soil moisture and evapotranspiration. These graphs assist to inform how much moisture is being lost from a turfgrass surface and provide an estimate of current soil moisture. This is important when balancing your farms moisture and growth to produce and optimal harvest. And knowing the evapotranspiration will help determine which night turf will require irrigation and how much.
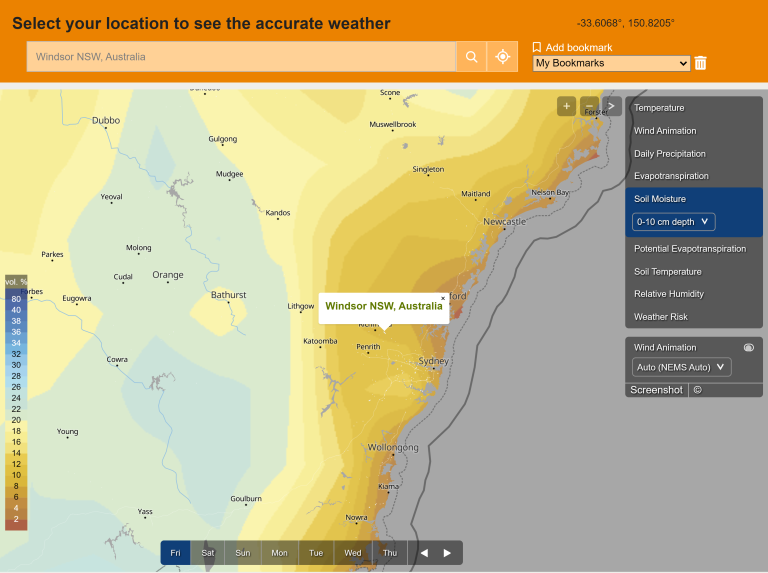
Figure 3: Soil Moisture, Greencast Weather Pro
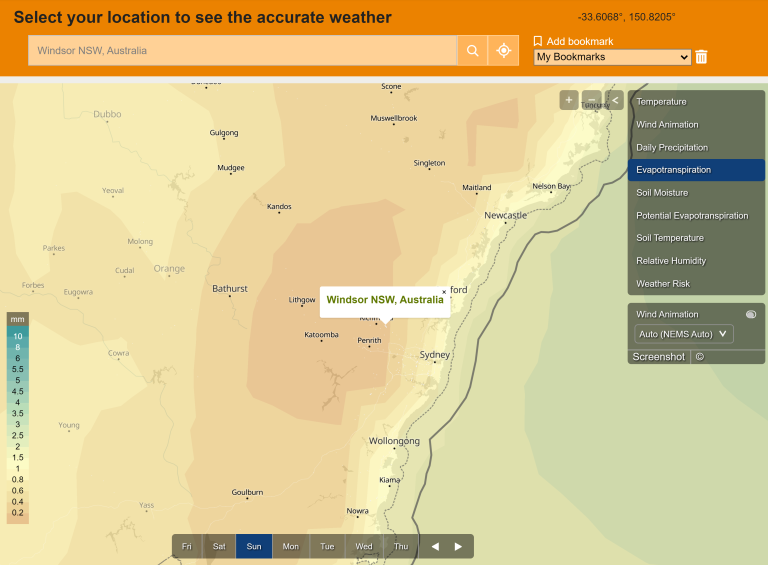
Figure 4: Evapotranspiration, Greencast Weather Pro
With Greencast Weather Pro you can also easily see weather changes through the week. By way of illustration in the figures 5, 6 and 7, we have looked at rainfall for Windsor in the week ahead. These graphs show predicted rainfall and if you hover your mouse over the exact location, you can see the expected millilitres as well. By knowing these predictions, you can plan the timing of insecticide and herbicide applications that require watering-in.
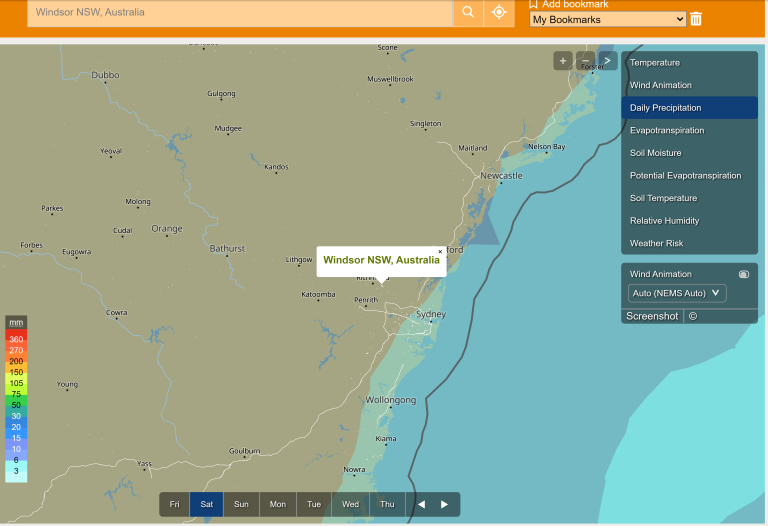
Figure 5: Predicted precipitation Sat 7/08/2021
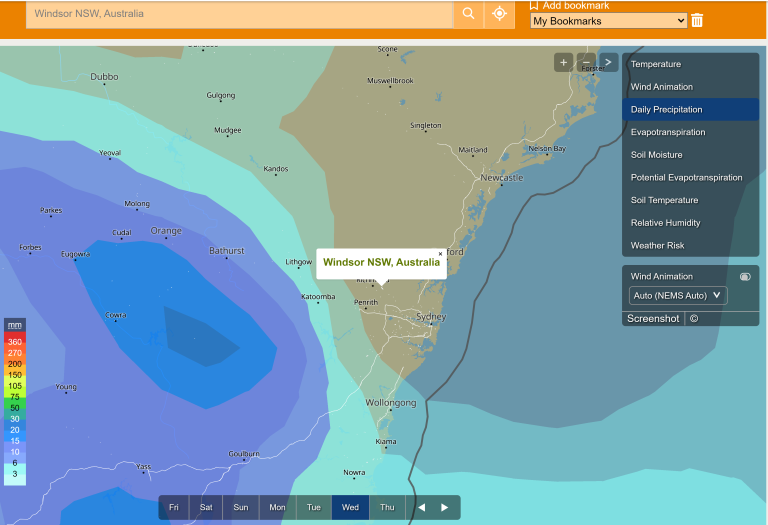
Figure 6: Predicted precipitation Wed 11/08/2021
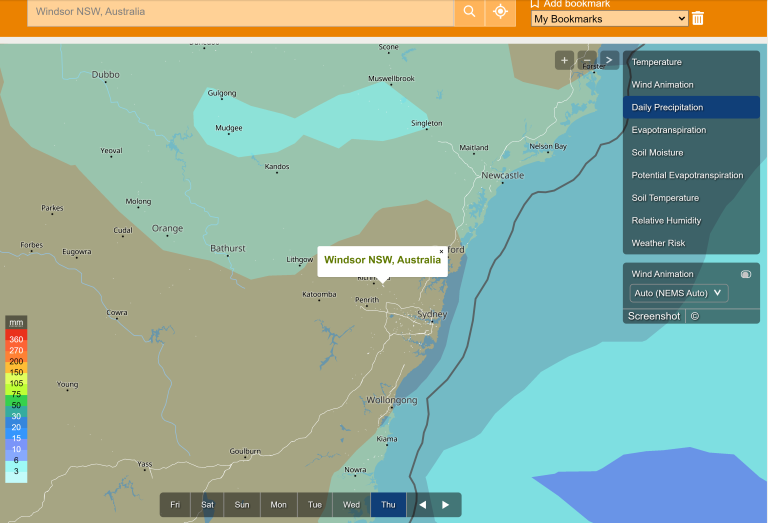
Figure 7: Predicted precipitation Thurs 12/08/2021
Similar detailed analysis can be done for the week ahead and wind speeds and wind directions. This is particularly important if you have buffer zones or no-spray zones close to your farm or sensitive crops such as vineyards close by. Spray applications can be timed for when breeze will be blowing lightly in the opposite direction.
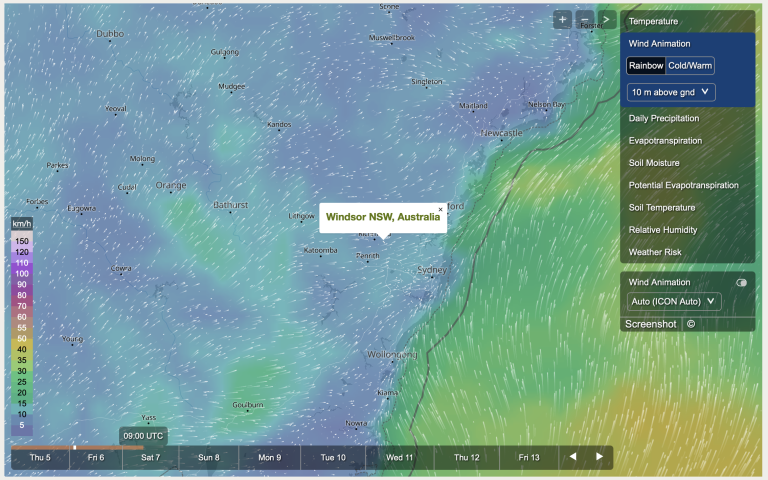
Figure 8: Wind Animation Sat 7/08/2021
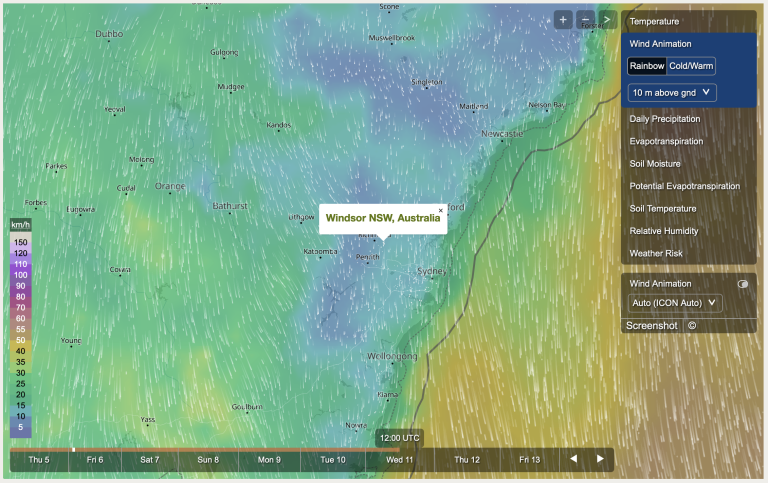
Figure 9: Wind Animation Wed 11/08/2021
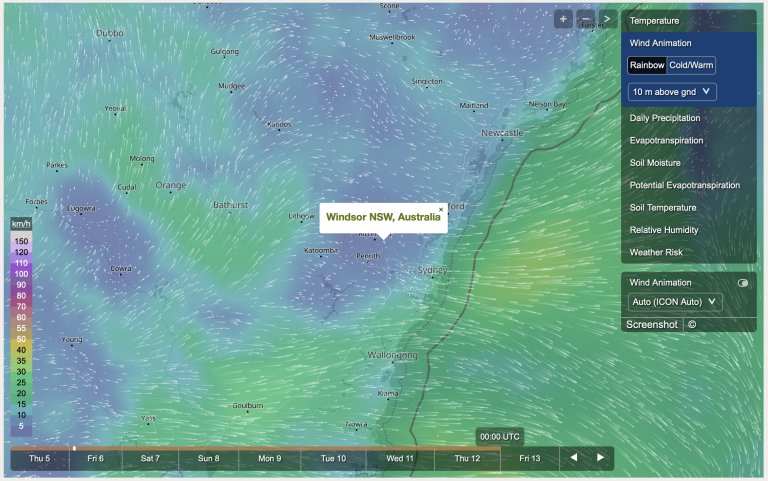
Figure 10: Wind Animation Thurs 12/08/2021
Greencast Weather Pro is available to all registered users of to the Syngenta Turf & Landscape website and can display information quickly and easily for the week such as:
- Soil temperature – See the potential for turf growth and recovery
- Wind speed and direction – Plan all your treatment scheduling for accurate application
- Weather risk – Advance warning of severe or potentially damaging weather events
- Humidity – Essential for turf disease risk assessment and preventative action
- Soil moisture map – Vital guide for irrigation scheduling and moisture management
- Evapotranspiration – Prevent stressful plant wilt and use available water more efficiently
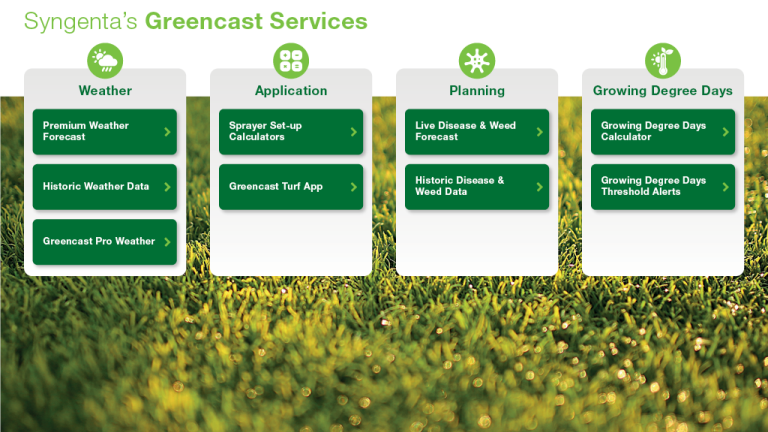
Additional Greencast Services
There are a number of other tools available in the Syngenta Greencast Services, including:
- Sprayer Set-up Calculator: Calibrate your sprayer with these helpful calculations to ensure precision application. Aiding to achieve maximum product efficacy.
- Premium Weather Forecast: is a comprehensive turf-specific weather forecasting and diagnostic tool.
- Historical Disease Data: an invaluable data source to visualise past turf disease patterns impacting your specific turf location. Assists with preventative programs.
- Live Disease forecast: provides predictive turf disease maps, with a 5-day forecast of specific disease risks across Australia and New Zealand.
- Growing Degree Days Calculator: tailored to your location, this is a weather-based tool to predict plant growth and optimal Primo Maxx application timing.
- Growing Degree Days Threshold Alerts: allows you to set notifications for when your location’s Growing Degree thresholds are reached across multiple turf surfaces.
All these tools are aimed at providing key decision-making information to help you get the most out of Syngenta’s innovative products through best practices. To start using these tools, visit syngentaturf.com.au and head to the “Turf Tools” section.
ED 21-194b